

This post was originally published on Power Sonic
As the shift towards sustainable transportation continues accelerating, electric vehicles (EVs) are becoming increasingly popular for drivers looking for their next car. Understanding EV charging, particularly charging times, is crucial. This knowledge helps in everyday use and planning longer journeys. It also answers one of potential buyers’ main questions: How long does it take to charge an electric vehicle?
The demand for EVs is growing worldwide. Recent industry reports show that by 2030, almost 1 in 5 cars on the road, both in the United States and the European Union, will be electric, indicating the increasing acceptance of electric vehicles in these markets. Substantial improvements in battery technology and charging speeds underpin this growth. Modern EVs now boast batteries with higher voltages and more energy density, supporting faster charging capabilities and reducing the time it takes to charge an electric car.
Understanding the factors that affect how long it takes to charge an electric vehicle is vital to owning one. This article explores these aspects, offering insights into what electric car owners and potential buyers can expect regarding EV charging times.
Factors Influencing How Long it Takes to Charge an EV
The time it takes to charge an electric vehicle can vary significantly based on several critical factors. Understanding these can help drivers manage their electric car charging schedules and expectations effectively. Here’s a deeper look into these influencing factors:
- Battery Size: The capacity of an EV’s battery, typically measured in kilowatt-hours (kWh), is a primary determinant of charging time. Larger batteries store more energy, which naturally takes longer to charge than smaller ones. For instance, an electric car with a 30 kWh battery will charge faster than a 100 kWh battery, assuming all other conditions are the same.
- Battery Architecture (Voltage Systems): Modern EVs have either 400-volt or 800-volt battery systems. Higher-voltage systems, like those in Tesla’s Cyber truck or the Porsche Taycan, can accept faster charging rates. For example, a 400-volt architecture EV might max out at around 150 kW, while an 800-volt EV could potentially handle charging rates of up to 360 kW or more. Vehicles with higher voltages can recharge faster with 800-volt charging, significantly reducing the total charging time.
- State of Charge (SOC) of the Battery: Charging time is also influenced by the initial state of charge of the battery when plugged in, basically what percentage the battery is at (empty 0% vs 100% full). Batteries charge faster when at a lower state of charge (emptier) and slow down as they approach full capacity. As the battery nears full charge, EV charging systems reduce power output to preserve battery health and safety. With AC charging stations, the charging speed remains relatively consistent. However, DC fast charging stations typically achieve the most rapid charging speeds when the battery is between 20% and 60%. As the battery level approaches 80% to 100%, the charging rate significantly slows down to protect battery health and ensure safety.
- Maximum Charging Acceptance Rate of the Vehicle: Each electric vehicle has a maximum charging rate it can handle, which might be less than what the charging station can deliver. For instance, if an electric car’s maximum charge rate is 100 kW, it won’t charge faster even if it’s connected to a 180 kW charger. This rate is determined by the vehicle’s onboard charging hardware and battery management systems. Most all-electric vehicles will have two charge acceptance rates: one for AC charging and the other for DC fast charging.
- Power Output of the Charging Station: The charging station’s maximum output, or how much power it can deliver, plays a critical role. Even if a vehicle can accept high power levels, the time required to charge will depend on whether the charging station can provide that power. Differences in station output can significantly affect charging times. Charging stations come in three different levels, which affect the charging speed – more on this to follow.
- Environmental Factors: Temperature extremes can impact battery performance and charging speed. In cold weather, batteries may need to be preheated using energy from the charger, which can slow down charging speed. Similarly, cooling systems might need to run in very hot conditions to keep the battery at an optimal temperature, affecting overall charging efficiency.
Having explored the factors that influence how long it takes to charge an electric vehicle, it’s clear that the choice of charging station plays a pivotal role. Each type of charging station, categorized into distinct levels, offers varying power outputs and, consequently, different charging speeds. Understanding these levels is essential as it helps in planning charging sessions and choosing the right electric car and charging infrastructure to suit lifestyle and travel demands.
Comparing Charging Times for Levels 1, 2, and 3
EV charging is categorized into three levels. Each EV charging level offers different power outputs, directly affecting how long it takes to charge an electric car at a charging station. Here’s an overview of each level, including its typical EV charging times and range gained per hour of charging. These charging times are based on the average usable energy of an electric car battery of 71 kWh and the average energy consumption of 300 Wh per mile.
Level 1 Charging Time
Level 1 EV chargers utilize a standard domestic AC socket. They can provide a power output of up to 1.8 kW in the US and up to 2.3 kW in Europe.
- Charging Time: This is the slowest charging option available, generally adding about 6 to 7 miles (9 -11 kilometres) of range per hour of charging. Charging the average-sized electric car battery from zero to full can take between 40 and 71 hours.
Level 1 EV chargers are impractical due to their low charging speeds. They are almost always used at home as a backup or a long-duration charging solution for EV owners with minimal daily mileage needs.
Level 2 Charging Time
Level 2 EV charging is much faster than Level 1. It utilizes a 208/240V AC connection in the US, enabling a 19.2 kW EV charger. In Europe, it uses a 230V (single-phase) or 400V (three-phase) connection, delivering up to 22 kW.
- Charging Time: Level 2 chargers speed up the time to charge an electric car, offering about 10 to 73 miles (16 – 117 kilometres) of range per hour, depending on the power output and vehicle compatibility. With this charging level, the average electric car battery would take 4 to 24 hours to charge fully.
Level 2 EV chargers are suitable for residential, workplace, and other public locations such as hotels, retail parks, and supermarkets, where longer-duration parking is standard.
Level 1 and Level 2 charging delivers alternating current (AC) to electric vehicles, converted to direct current (DC) via an onboard charger before going to the battery.
Level 3 Charging Time
Level 3 charging, also known as DC fast charging (DCFC), delivers DC instead of AC. This type of EV charging bypasses the car’s onboard charger, providing power directly to the battery for much faster charging times. These charging stations utilize a three-phase input and can output power from 30 kW to over 360 kW.
- Charging Time: DCFC is the fastest charging option available. It can fully charge some electric cars in under 20 minutes and deliver about 100 to 1200 miles of range per hour of charging.
DCFC is crucial for reducing downtime during long-distance travel. It is found primarily along highways and in urban areas where quick recharging is necessary.
The EV range chart below indicates how much range can potentially be added to an an electric vehicle per hour of charging using different level charging stations.
| Level 1 | Level 1 | Level 2 | Level 2 | Level 2 | Level 2 | Level 2 | Level 2 | DCFC | DCFC | DCFC | DCFC | DCFC | DCFC | |
| 1.8 kW | 2.3 kW | 3.7 kW | 7.6 kW | 9.6 kW | 11 kW | 19.2 kW | 22 kW | 30 kW | 60 kW | 120 kW | 150 kW | 180 kW | 360 kW | |
| Miles (up to) | 6 | 7 | 12 | 25 | 32 | 36 | 64 | 73 | 100 | 200 | 400 | 500 | 600 | 1200 |
| Kilometres (up to) | 9 | 11 | 19 | 40 | 51 | 57 | 102 | 117 | 160 | 321 | 643 | 804 | 965 | 1930 |
These range per hour figures are estimates only and are based on the average energy consumption of an electric car of 300 Wh per mile. Range per hour can vary greatly depending on the efficiency of the vehicle, how it is driven, how full the battery is, and the charging curve..
Estimating Charge Time For Electric Vehicles
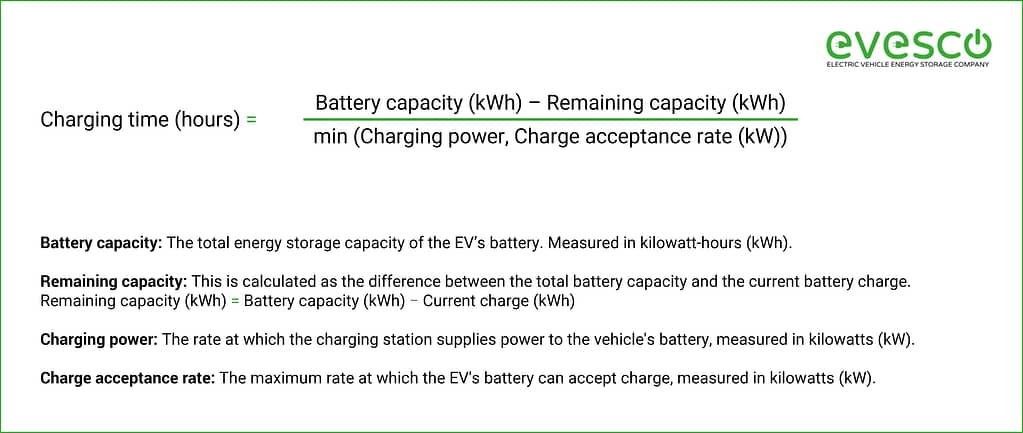
The basic formula to calculate the estimated charging time for an electric vehicle is:
Charging time (hours)= Battery capacity (kWh) – Remaining battery capacity / Charging power (kW) or Charge acceptance rate of vehicle (kW), whichever is lower. See the illustration below.
This formula estimates how long it takes to charge an EV with an AC charger. See the illustration below.
Step-by-Step Calculation:
- Determine Battery Capacity: Your EV’s battery’s total energy storage capacity is listed in kWh. For instance, if your EV’s battery capacity is 80 kWh, you’ll use this figure.
- Assess Current Battery State of Charge: Check how much charge your battery has. This information is accessible on your in-vehicle display. If your battery is 50% charged and the total capacity is 80 kWh, the current charge is 40 kWh. Thus, you need to top up 40 kWh to reach full charge.
- Charger Power Output: This is the maximum rate at which the charging station can deliver power to your EV, which is measured in kW.
- Vehicle Charge Acceptance Rate: This is the maximum power in kW that the vehicle’s battery can input from an AC or a DC charger. The DC charge acceptance rate will be much higher than the AC acceptance rate.
- Calculate Charging Time: Subtract the current battery state of charge from the total capacity to find out how much energy is needed. Then, divide this number by the power output of your charger or the vehicle’s charge acceptance rate, whichever is lowest.
Example Calculations for EV Charging Times
AC Charging: An EV with an 80 kWh battery, 50% charged, 11 kW charge acceptance rate, using a 7.6 kW Level 2 charger:
- Charge needed = 80 kWh−40 kWh = 40 kWh
- Charging Time = 40 kWh / 7.6 kW = 5.26 hours
In this example, we have used the charger’s maximum output power, which is lower than the electric vehicle’s charge acceptance rate.
Considering the Tapering Effect
The tapering effect is especially relevant for DC fast charging. As the battery approaches full charge, the charging speed will decrease to protect the battery’s life and health. This tapering means the last 20% of the battery might charge slower than the first 80%.
The diagram below shows AC charging (Levels 1 and 2) and DC fast charging (Level 3) curves and how they differ. You will notice the tapering.
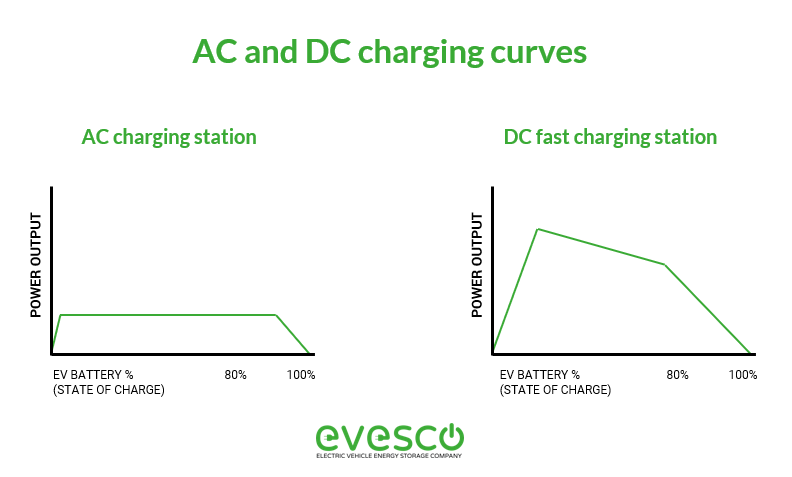
Each electric vehicle has a unique charging curve that dictates how long it takes to charge. This means you could have two electric cars with the same DC charge acceptance rate, but when they are plugged into a charging station, they both charge differently based on their unique charging curve.
These unique charging curves make it difficult to estimate how long it takes to charge an electric vehicle with a DC fast charging station. An electric vehicle’s average charge rate, when charging between 10% and 80%, can vary between 40% and 90% of the vehicle’s maximum charge acceptance rate. The table below shows examples of electric cars’ maximum charge acceptance rates compared to their average charge rate.
| Model | Maximum Charge Acceptance Rate | Average Charging Power (10% – 80%) | Percentage of |
| Tesla Model 3 | 170 kW | 100 kW | 59% |
| BYD ATTO 3 | 89 kW | 73 kW | 82% |
| MG 4 | 142 kW | 116 kW | 82% |
| Lotus Emeya S | 350 kW | 240 kW | 69% |
| Porsche Taycan Plus | 320 kW | 230 kW | 72% |
| Mini Aceman SE | 95 kW | 76 kW | 80% |
| Ford Mustang Mach-E | 150 kW | 95 kW | 63% |
| Hyundai IONIQ 6 | 175 kW | 140 kW | 80% |
| Volkswagen ID Buzz GTX | 185 kW | 130 kW | 70% |
| Genesis GV60 Premium | 233 kW | 200 kW | 86% |
As you can see from the table above, each electric vehicle’s charging time will differ based on its unique charging curve; this makes the previous formula not applicable for DC fast charging. You will need to review the specifications for the specific electric vehicle to understand the charging time when using a DC fast charger.
Electric Car Charging Time
Below, we have created a table of the best-selling electric cars, detailing their battery size, charge acceptance rates, and estimated charging time. This table will show estimates of how long it takes to charge popular electric cars.
| Battery Size (usable) | AC Charge Acceptance Rate | Estimated AC Charge Time 0% – 100% | DC Charge Acceptance Rate (maximum) | Average DC Charge Rate 10% – 80% | Estimated DC Charge Time 10% – 80% | |
| Tesla Model Y (RWD) | 68 kWh | 11 kW | 6 hours 12 mins | 170 kW | 100 kW | 29 minutes |
| Tesla Model 3 (RWD) | 68 kWh | 11 kW | 6 hours 12 mins | 170 kW | 100 kW | 29 minutes |
| Volkswagen ID 4 (GTX) | 77 kWh | 11 kW | 7 hours | 175 kW | 120 kW | 27 minutes |
| MG 4 | 51 kWh | 6.6 kW | 7 hours 42 mins | 87 kW | 68 kW | 32 minutes |
| Skoda Enyaq (60) | 58 kWh | 11 kW | 5 hours 18 mins | 124 kW | 82 kW | 30 minutes |
| Fiat 500 | 21.3 kWh | 11 kW | 1 hour 54 mins | 50 kW | 40 kW | 23 minutes |
| Volkswagen ID 3 (Pro) | 58 kWh | 11 kW | 5 hours 18 mins | 120 kW | 80 kW | 31 minutes |
| Dacia Spring (45) | 25 kWh | 6.6 kW | 3 hours 48 mins | 34 kW | 29 kW | 37 minutes |
| BMW i4 (eDrive35) | 67 kWh | 11 kW | 6 hours 6 mins | 180 kW | 95 kW | 30 minutes |
| Audi Q4 (e-tron 45 Quattro) | 77 kWh | 11 kW | 7 hours | 175 kW | 120 kW | 27 minutes |
These charging times are estimated based on assumptions intended only for general comparison. Actual charging times depend on several factors, including the vehicle’s charging capability, usable battery capacity, energy losses, current state of charge, charger output, and environmental conditions. Understanding how to estimate how long it takes to charge an electric vehicle and the factors that affect it helps current and prospective EV owners manage their charging expectations and make informed decisions about electric cars and charging infrastructure.


0 Comments